Double Result Basketball Betting: HT/FT Odds and Market Strategy
 Available in US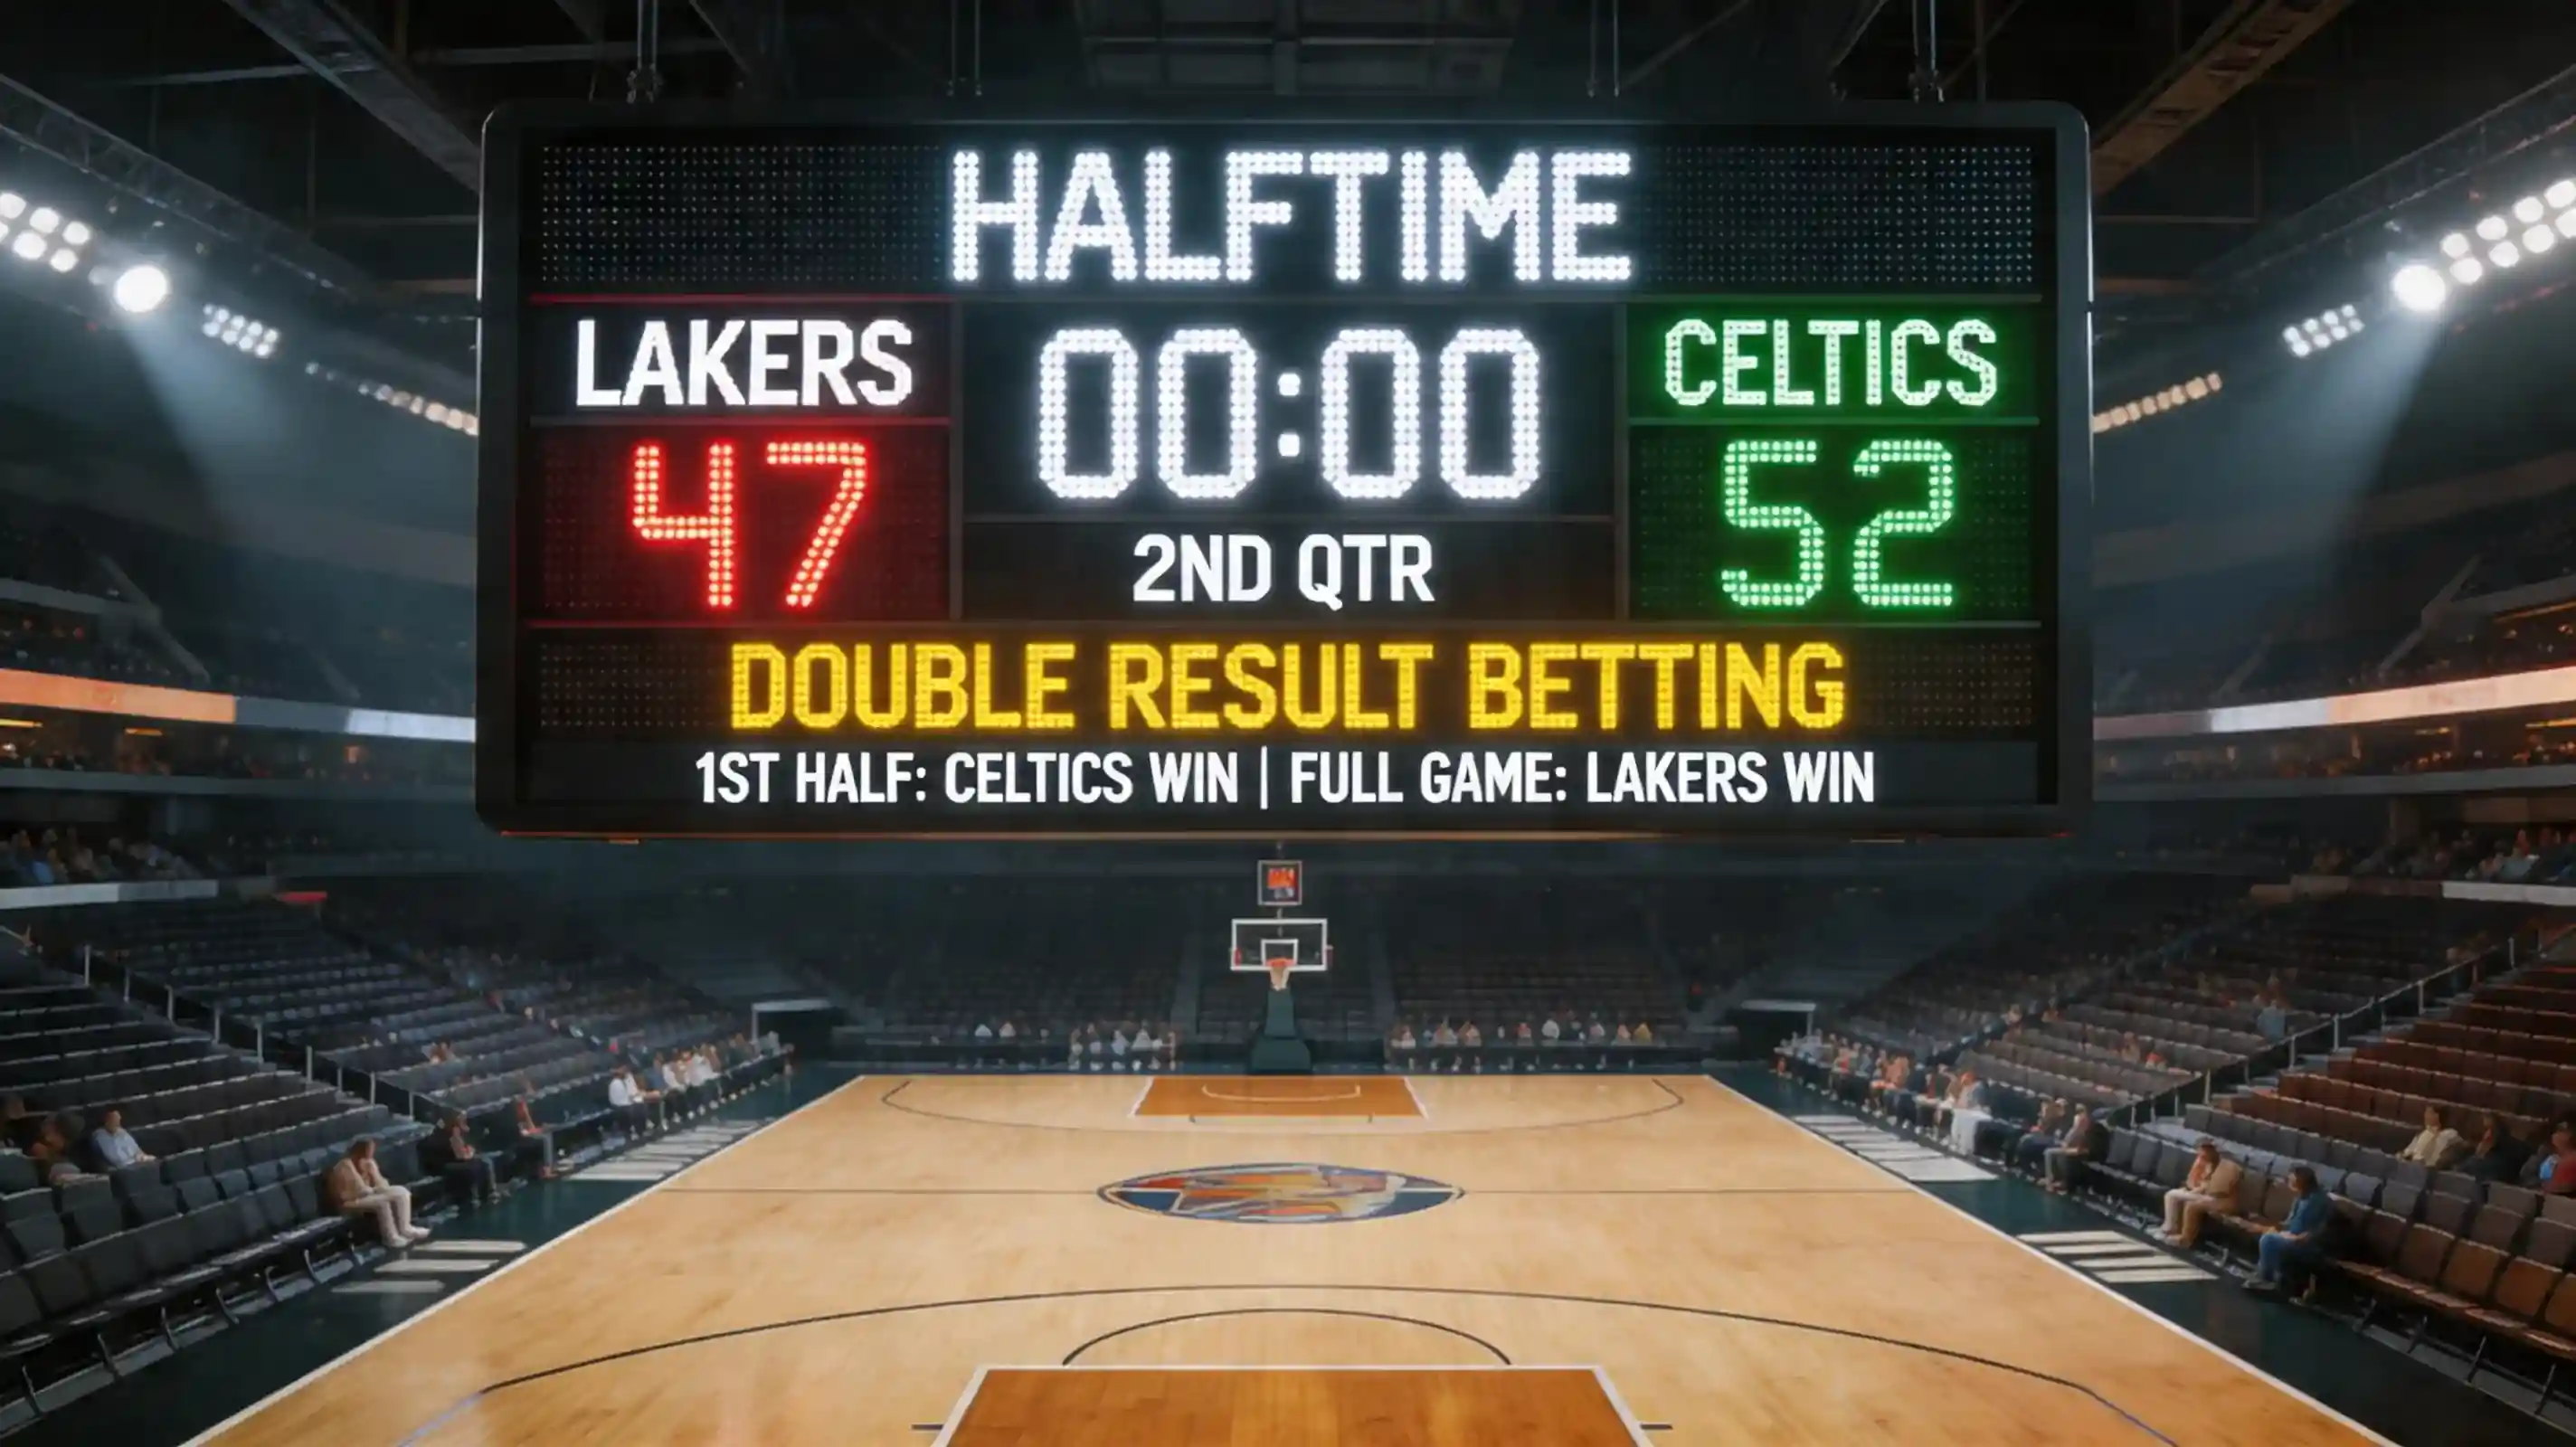
The Warriors lost at halftime but won the game — a sentence that cost me money before I understood double result betting. I’d backed Golden State to lead at half and win, expecting their third-quarter dominance to simply extend a halftime advantage. Instead, they trailed by four at the break before their famous third-quarter explosion produced a comfortable final margin. The lesson: halftime leads and final results are distinct predictions that don’t always align.
Double result markets require predicting both halftime leader and full-time winner. Nine possible combinations exist: home leads at half and wins; home leads at half and loses; home leads at half and draws; and so on across away and draw halftime scenarios. This market structure creates pricing complexity that rewards careful analysis of game flow tendencies.
Analysing Half-Time/Full-Time Betting Correlations
Standard double result offers nine outcomes combining three halftime possibilities with three full-time possibilities. Most basketball double result markets simplify by excluding draws, recognising that tied halftimes and tied finals are rare in basketball compared to football.
The most common outcomes — home leads and wins, away leads and wins — carry the shortest odds. These represent straightforward scenarios where one team establishes early control and maintains it. Pricing these outcomes involves simply compounding halftime and full-time probabilities with some correlation adjustment.
Comeback scenarios offer substantial odds. A team trailing at halftime that wins must overcome a deficit and complete the victory. These outcomes combine improbability with the excitement of dramatic recovery, creating odds that attract recreational interest.
The mathematical relationship between halftime and full-time results isn’t independent. Teams leading at halftime win more often than baseline probabilities suggest; halftime leads correlate with full-time wins. Double result pricing must account for this correlation rather than simply multiplying independent probabilities.
Tied-at-half scenarios create interesting middle-ground outcomes. A team that’s level at halftime and wins essentially just needs to outscore opponents in the second half. These outcomes carry moderate odds but occur with reasonable frequency, particularly in evenly-matched games.
Some operators offer simplified half-time/full-time markets with fewer combinations. These might exclude tied halftime scenarios or focus only on comeback possibilities. Understanding which specific combinations your operator offers prevents confusion about available bets.
Basketball Comeback Patterns
Basketball’s high-scoring nature makes comebacks more common than in low-scoring sports. A team trailing by eight points at halftime faces a deficit that’s substantial but far from insurmountable. This comeback frequency affects double result value calculations.
Research suggests NBA teams leading after the first half win approximately 75-80% of games. That means 20-25% of games involve halftime leaders who eventually lose — a meaningful comeback rate that creates opportunities for bettors understanding reversal dynamics.
Certain team profiles produce comebacks more frequently. Teams with strong bench units often trail against starters before dominating when rotations tighten. Teams with elite closers might trail early before asserting control in fourth quarters. Identifying these patterns improves comeback probability estimation.
Deficit magnitude matters considerably. A two-point halftime deficit rarely indicates sustainable advantage; a fourteen-point halftime deficit suggests genuinely lopsided performance. The threshold where deficits become insurmountable varies by team quality differential and specific game context.
Historical comeback data by team provides useful baselines. Some teams rarely surrender halftime leads; others do so regularly. Some teams frequently overcome deficits; others rarely mount successful rallies. These tendencies inform team-specific double result projections.
Third Quarter Dynamics
The third quarter often determines whether halftime results hold or reverse. Teams make halftime adjustments; energy levels shift after extended breaks; psychological momentum either continues or fractures. Understanding third-quarter patterns improves double result analysis.
Certain teams dominate third quarters. The Warriors’ historic third-quarter prowess meant they regularly overcame halftime deficits through explosive post-break stretches. Backing them in “trailing at half, winning at finish” scenarios reflected genuine tendency rather than mere hope.
Away team third-quarter performance tends to decline. Home crowds energise hosts after halftime; visiting players must regenerate focus without that boost. This home third-quarter advantage suggests halftime-leading visitors face elevated comeback risk compared to halftime-leading hosts.
Coaching adjustments manifest in third quarters. The team that trails at halftime has fifteen minutes to devise counters. Elite coaching staffs convert halftime deficits into third-quarter advantages through strategic adaptation. Coaching quality affects comeback probability assessment.
Foul trouble dynamics often crystallise in third quarters. A star player with three fouls at halftime might play cautiously or sit extended minutes in the third, enabling opponent runs. Monitoring foul situations at halftime improves third-quarter projections.
Value Identification
Value in double result markets typically exists where correlation pricing errs. If a market prices “home trails at half but wins” based on independent probability multiplication without adequate comeback correlation adjustment, value opportunities emerge.
Public betting patterns create pricing inefficiencies. Most recreational bettors back straightforward scenarios — the favourite to lead throughout. This public weight on “leads and wins” combinations might inflate those prices while leaving comeback scenarios underpriced.
Pace expectations affect double result analysis. High-pace games produce more scoring variance, making halftime leads less stable. Slow, grinding affairs produce results that hold more consistently. Adjusting for expected pace improves correlation estimation.
Game context affects comeback probability beyond baseline rates. Playoff intensity increases comeback frequency as teams fight harder through deficits. Regular season games with eliminated teams might see earlier surrender. Adjusting for context improves value identification.
Live betting offers double result alternatives. Rather than pre-game commitment to halftime/full-time combinations, you can assess halftime results as they occur and bet remaining outcomes. This reduces prediction dimensions from two to one, simplifying analysis at the cost of reduced odds.
Combining double result with other markets creates structured positions. Taking “away leads at half” in double result while backing home spread creates scenarios where either half or full-time performance produces returns. These combinations require careful stake calculation.
For analysis of quarter-by-quarter betting approaches that inform double result thinking, quarter betting fundamentals addresses period-level market dynamics.
What is double result betting in basketball?
Double result requires predicting both halftime leader and full-time winner. Nine combinations exist: each of three halftime possibilities paired with three full-time possibilities. Most basketball markets simplify by excluding ties. Odds compound halftime and full-time probabilities with correlation adjustments.
How often do basketball teams come back from halftime deficits?
NBA teams leading at halftime win approximately 75-80% of games, meaning 20-25% of games involve successful comebacks. Comeback frequency varies by deficit size, team profiles, and game context. Teams with strong benches or elite closers tend to overcome deficits more frequently.
Created by the ”Live Basketball Betting” editorial team.