Back-to-Back NBA Betting: Fatigue Impact on Spread Odds
 Available in US
The numbers that changed how I think about NBA scheduling came from a random Reddit thread three years ago. Someone had tracked every back-to-back game for a decade, and the patterns were striking: teams on the second night of back-to-backs covered at rates significantly below expectation. Not dramatically — this isn’t a money printer — but consistently enough to warrant serious attention.
NBA teams play an average of 14.9 back-to-back games per season, a number that’s declined roughly 23% over the past decade as the league has prioritised player health. But even reduced, these schedule spots create predictable fatigue patterns that markets sometimes underprice. Understanding how tiredness translates to performance — and when that translation is already reflected in the spread — separates informed bettors from those blindly fading tired teams.
Tracking Roster Fatigue and Performance Drops
The aggregate data is clear: teams perform worse on the second night of back-to-backs. Win rates drop, point differentials shrink, and the effect persists across decades of analysis. Research examining ten years of NBA data found measurable physical decline between first and fourth quarters, with an effect size of -1.27 — substantial in statistical terms.
But aggregate numbers hide important variation. The fatigue effect depends on travel distance, rest before the back-to-back, and opponent quality. A home back-to-back following a home game produces minimal disadvantage. A road back-to-back crossing time zones after a gruelling overtime win produces maximum disadvantage. These situations shouldn’t be treated identically.
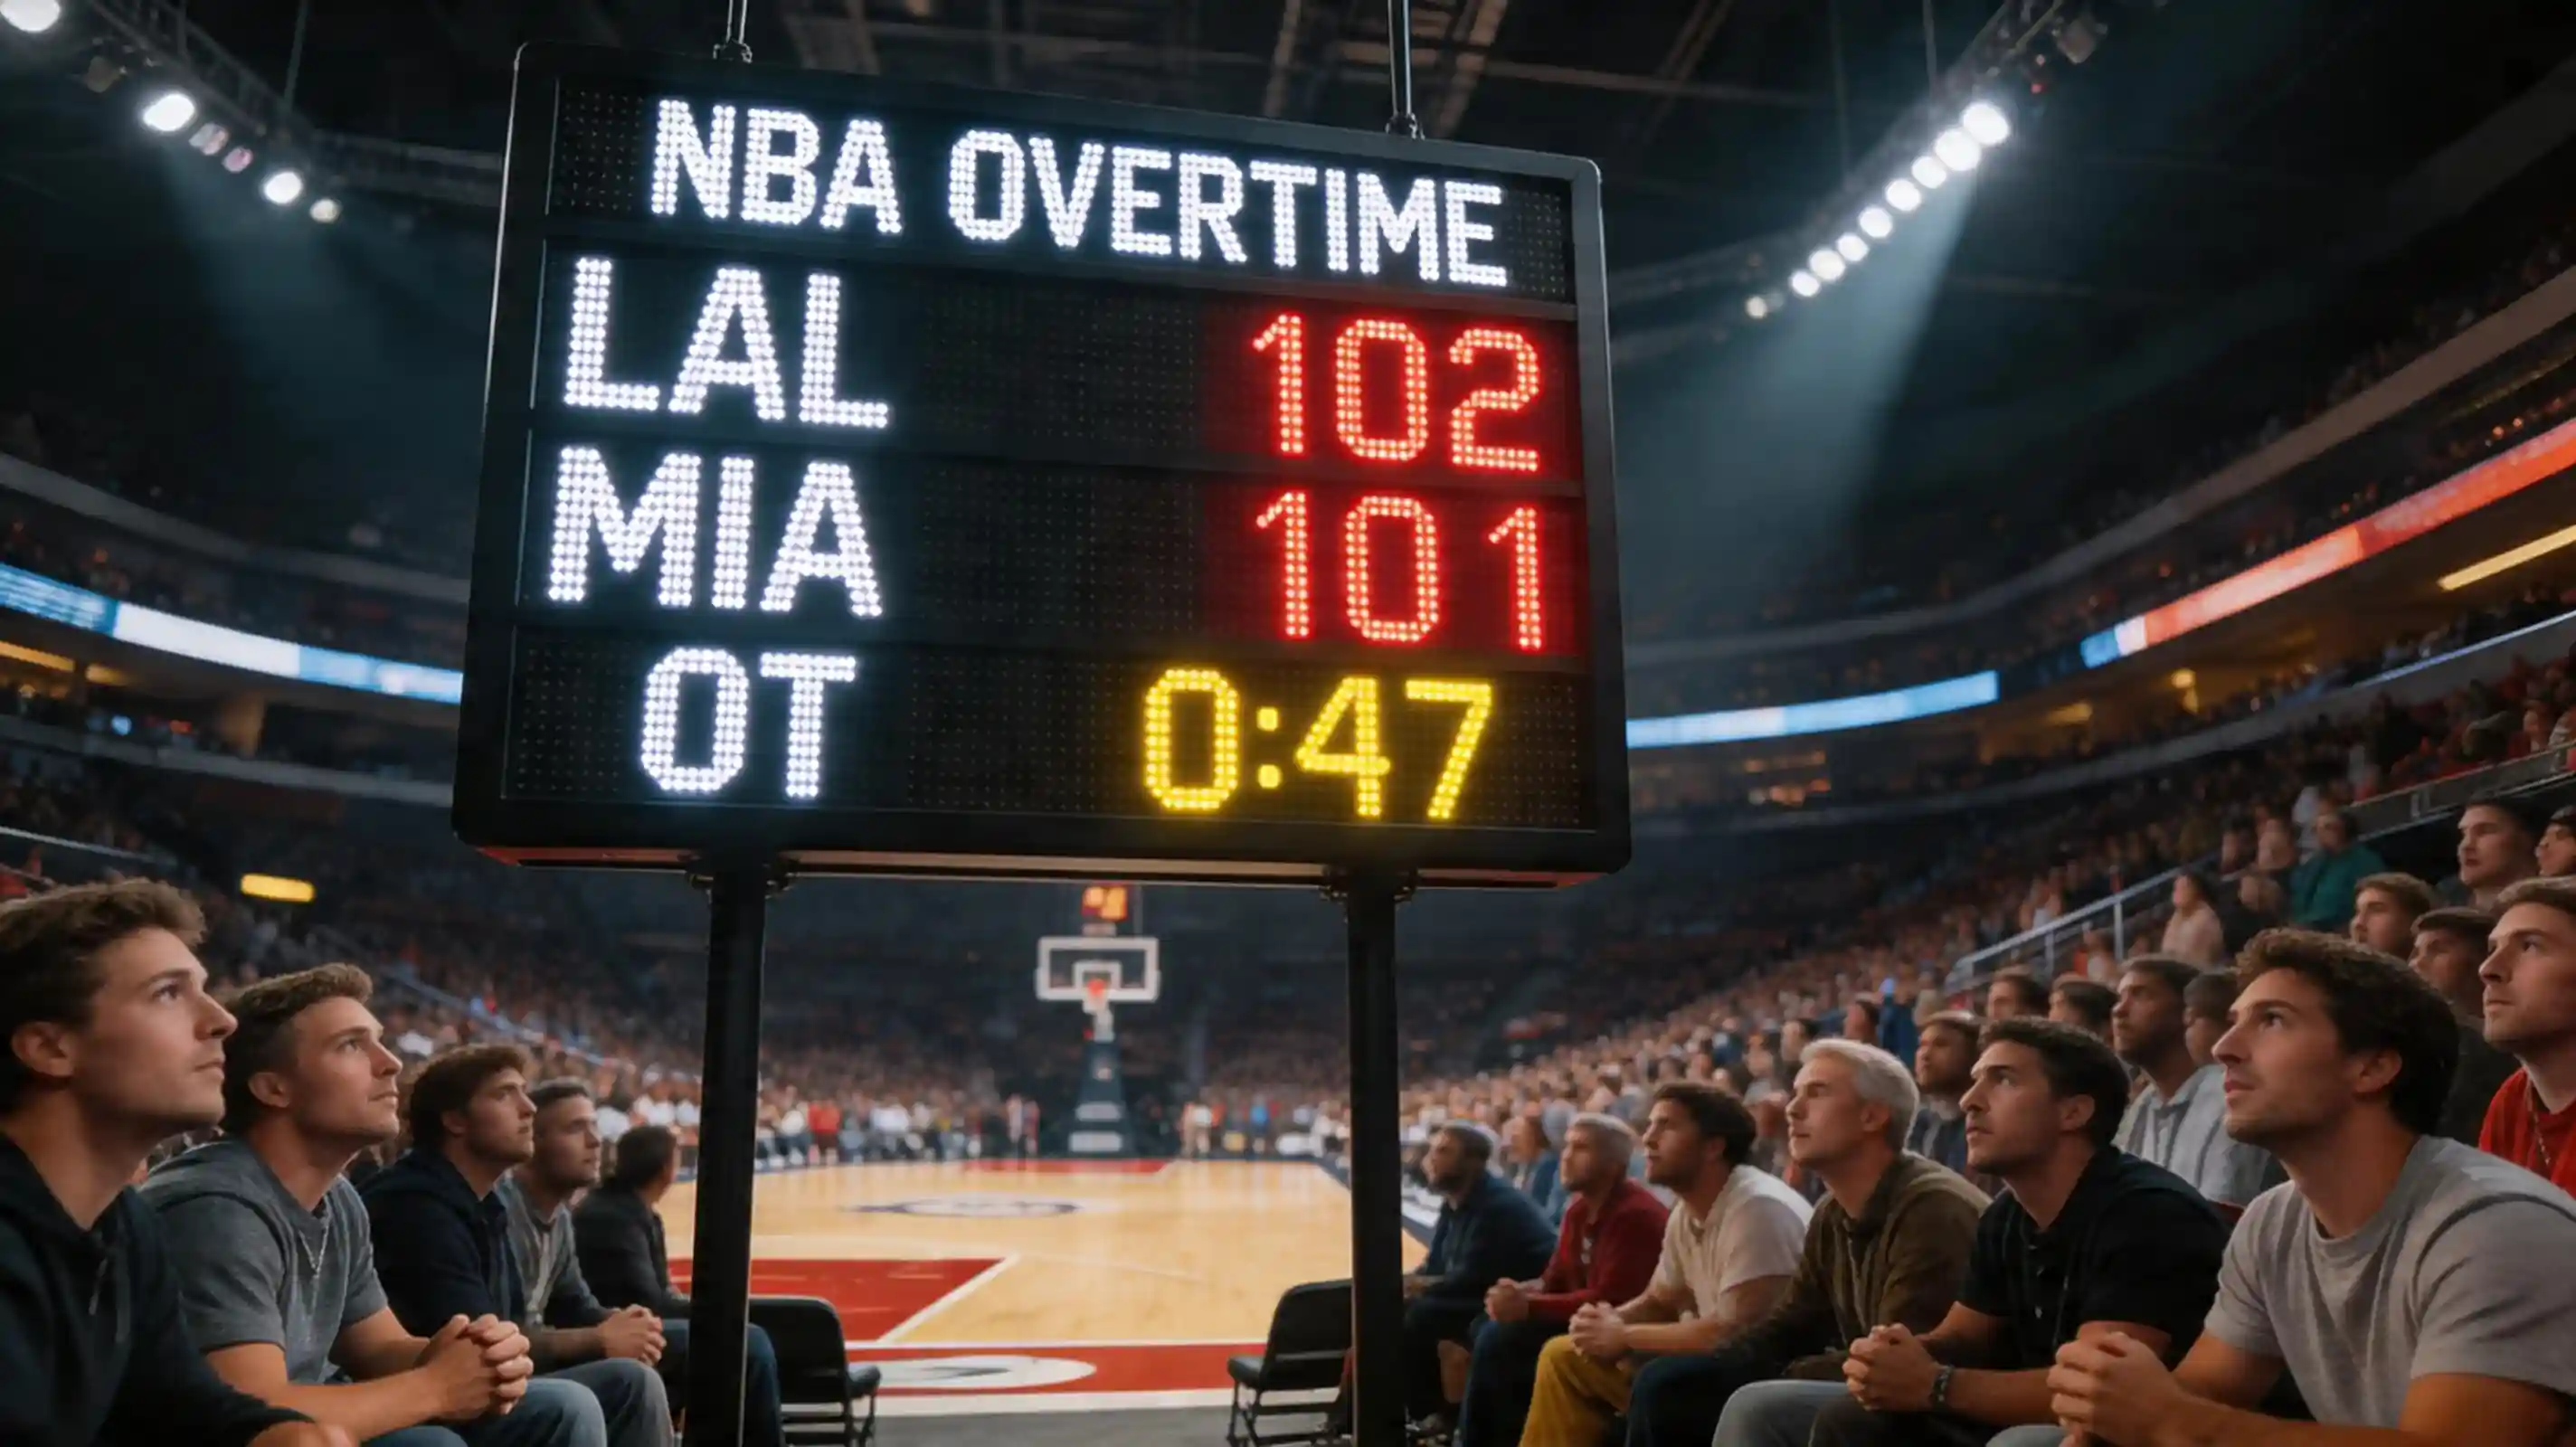
Fourth quarter performance reveals fatigue most clearly. Teams on back-to-backs maintain competitive first halves before declining late. The legs go, the focus wanes, and opponents capitalize. This pattern suggests fourth-quarter specific markets might capture back-to-back effects more directly than full-game spreads.
Three-point shooting suffers notably on back-to-backs. The fatigue in legs translates directly to shooting form — tired legs produce flat jumpers. Teams relying heavily on perimeter shooting face steeper declines than those attacking the rim. Knowing a team’s offensive style helps predict how severely fatigue will affect their output.
Star player impact complicates analysis. Load management means key players sometimes sit the second night entirely, creating a different situation than playing stars heavy minutes while tired. Teams resting stars on back-to-backs face steep declines; teams playing full rosters face moderate fatigue effects. The distinction matters enormously.
Season timing affects back-to-back severity. Early-season back-to-backs hit teams while still building conditioning. Late-season back-to-backs hit accumulated fatigue but also routine adaptation. Playoff races create motivation that overcomes physical tiredness. January back-to-backs in the dead of winter might produce the largest effects, though this requires careful sample construction to verify.
Spread Adjustment
Markets do adjust for back-to-backs, but the adjustments aren’t uniform. Major back-to-back situations — road team playing second night on short travel — see spreads move a full point or more. Subtle situations — home team on back-to-back against road team on rest — see smaller adjustments that might not fully reflect fatigue impact.
The betting public overweights recent performance relative to schedule situations. A team that won convincingly last night looks strong heading into tonight’s game, even though that win depleted them. Sharp bettors look past last night’s box score to tonight’s context. This creates opportunities when public perception diverges from fatigue reality.
Line movement patterns reveal when markets have fully priced fatigue. If the opening line already reflects back-to-back disadvantage, betting the tired team isn’t contrarian — it’s aligned with sharp opinion. Watch for lines that move toward the rested team as game time approaches; that movement suggests initial pricing underestimated fatigue impact.
Total market adjustments for back-to-backs follow less clear patterns. Theoretically, tired teams play slower and score less, suggesting unders. But tired teams also defend less intensely, allowing opponent scoring. The net effect on totals varies by matchup and situation more than spreads do.
Rest Advantage
The flip side of back-to-back analysis is rest advantage. Teams with multiple days off face opponents on compressed schedules, creating competitive edges that compound beyond single-game fatigue.
Three or more days of rest typically produce performance bumps, though not unlimited — teams can rust with excessive time off. The sweet spot seems to be two to three days of rest, enough to recover without losing rhythm. Teams coming off six-day breaks sometimes start slowly before finding form.
Rest disparities create the largest edges. When a team with three days off hosts an opponent playing their fourth game in five nights, the schedule mismatch approaches maximum. Markets attempt to price these disparities but may underweight the cumulative effect of multiple compressed games.
Practice time matters alongside physical rest. Teams with several days off can incorporate new plays, address weaknesses, and prepare specifically for opponents. Teams grinding through compressed schedules barely maintain conditioning, let alone tactical development. This preparation gap compounds the physical rest advantage.
Playoff implications differ from regular season patterns. Teams playing game seven fly to face a rested opponent in the next round face severe disadvantage — emotional exhaustion compounds physical fatigue. Series length affects subsequent series readiness in ways that regular season back-to-back analysis doesn’t capture.
Travel Considerations
Back-to-back severity scales with travel distance. Home-home back-to-backs barely register as disadvantages. Cross-country road back-to-backs create substantial impairment. The miles travelled overnight matter more than the simple designation “back-to-back.”
Time zone changes amplify fatigue effects. Teams flying east lose sleep directly; teams flying west play games while their body thinks it’s midnight. The NBA schedule creates particular problems for California teams heading east on back-to-backs and for East Coast teams playing late games on the West Coast before early tips back home.
Charter flights have reduced but not eliminated travel fatigue. Teams no longer deal with commercial flight hassles, but even private travel can’t overcome basic biology. A 3am landing after a West Coast game leaves players sleep-deprived regardless of how comfortable the plane was.
Altitude changes add another layer. Teams playing in Denver on the second night of a back-to-back face compounded challenges — altitude effects hit hardest when bodies are already depleted. These specific situations deserve closer attention than generic back-to-back analysis provides.
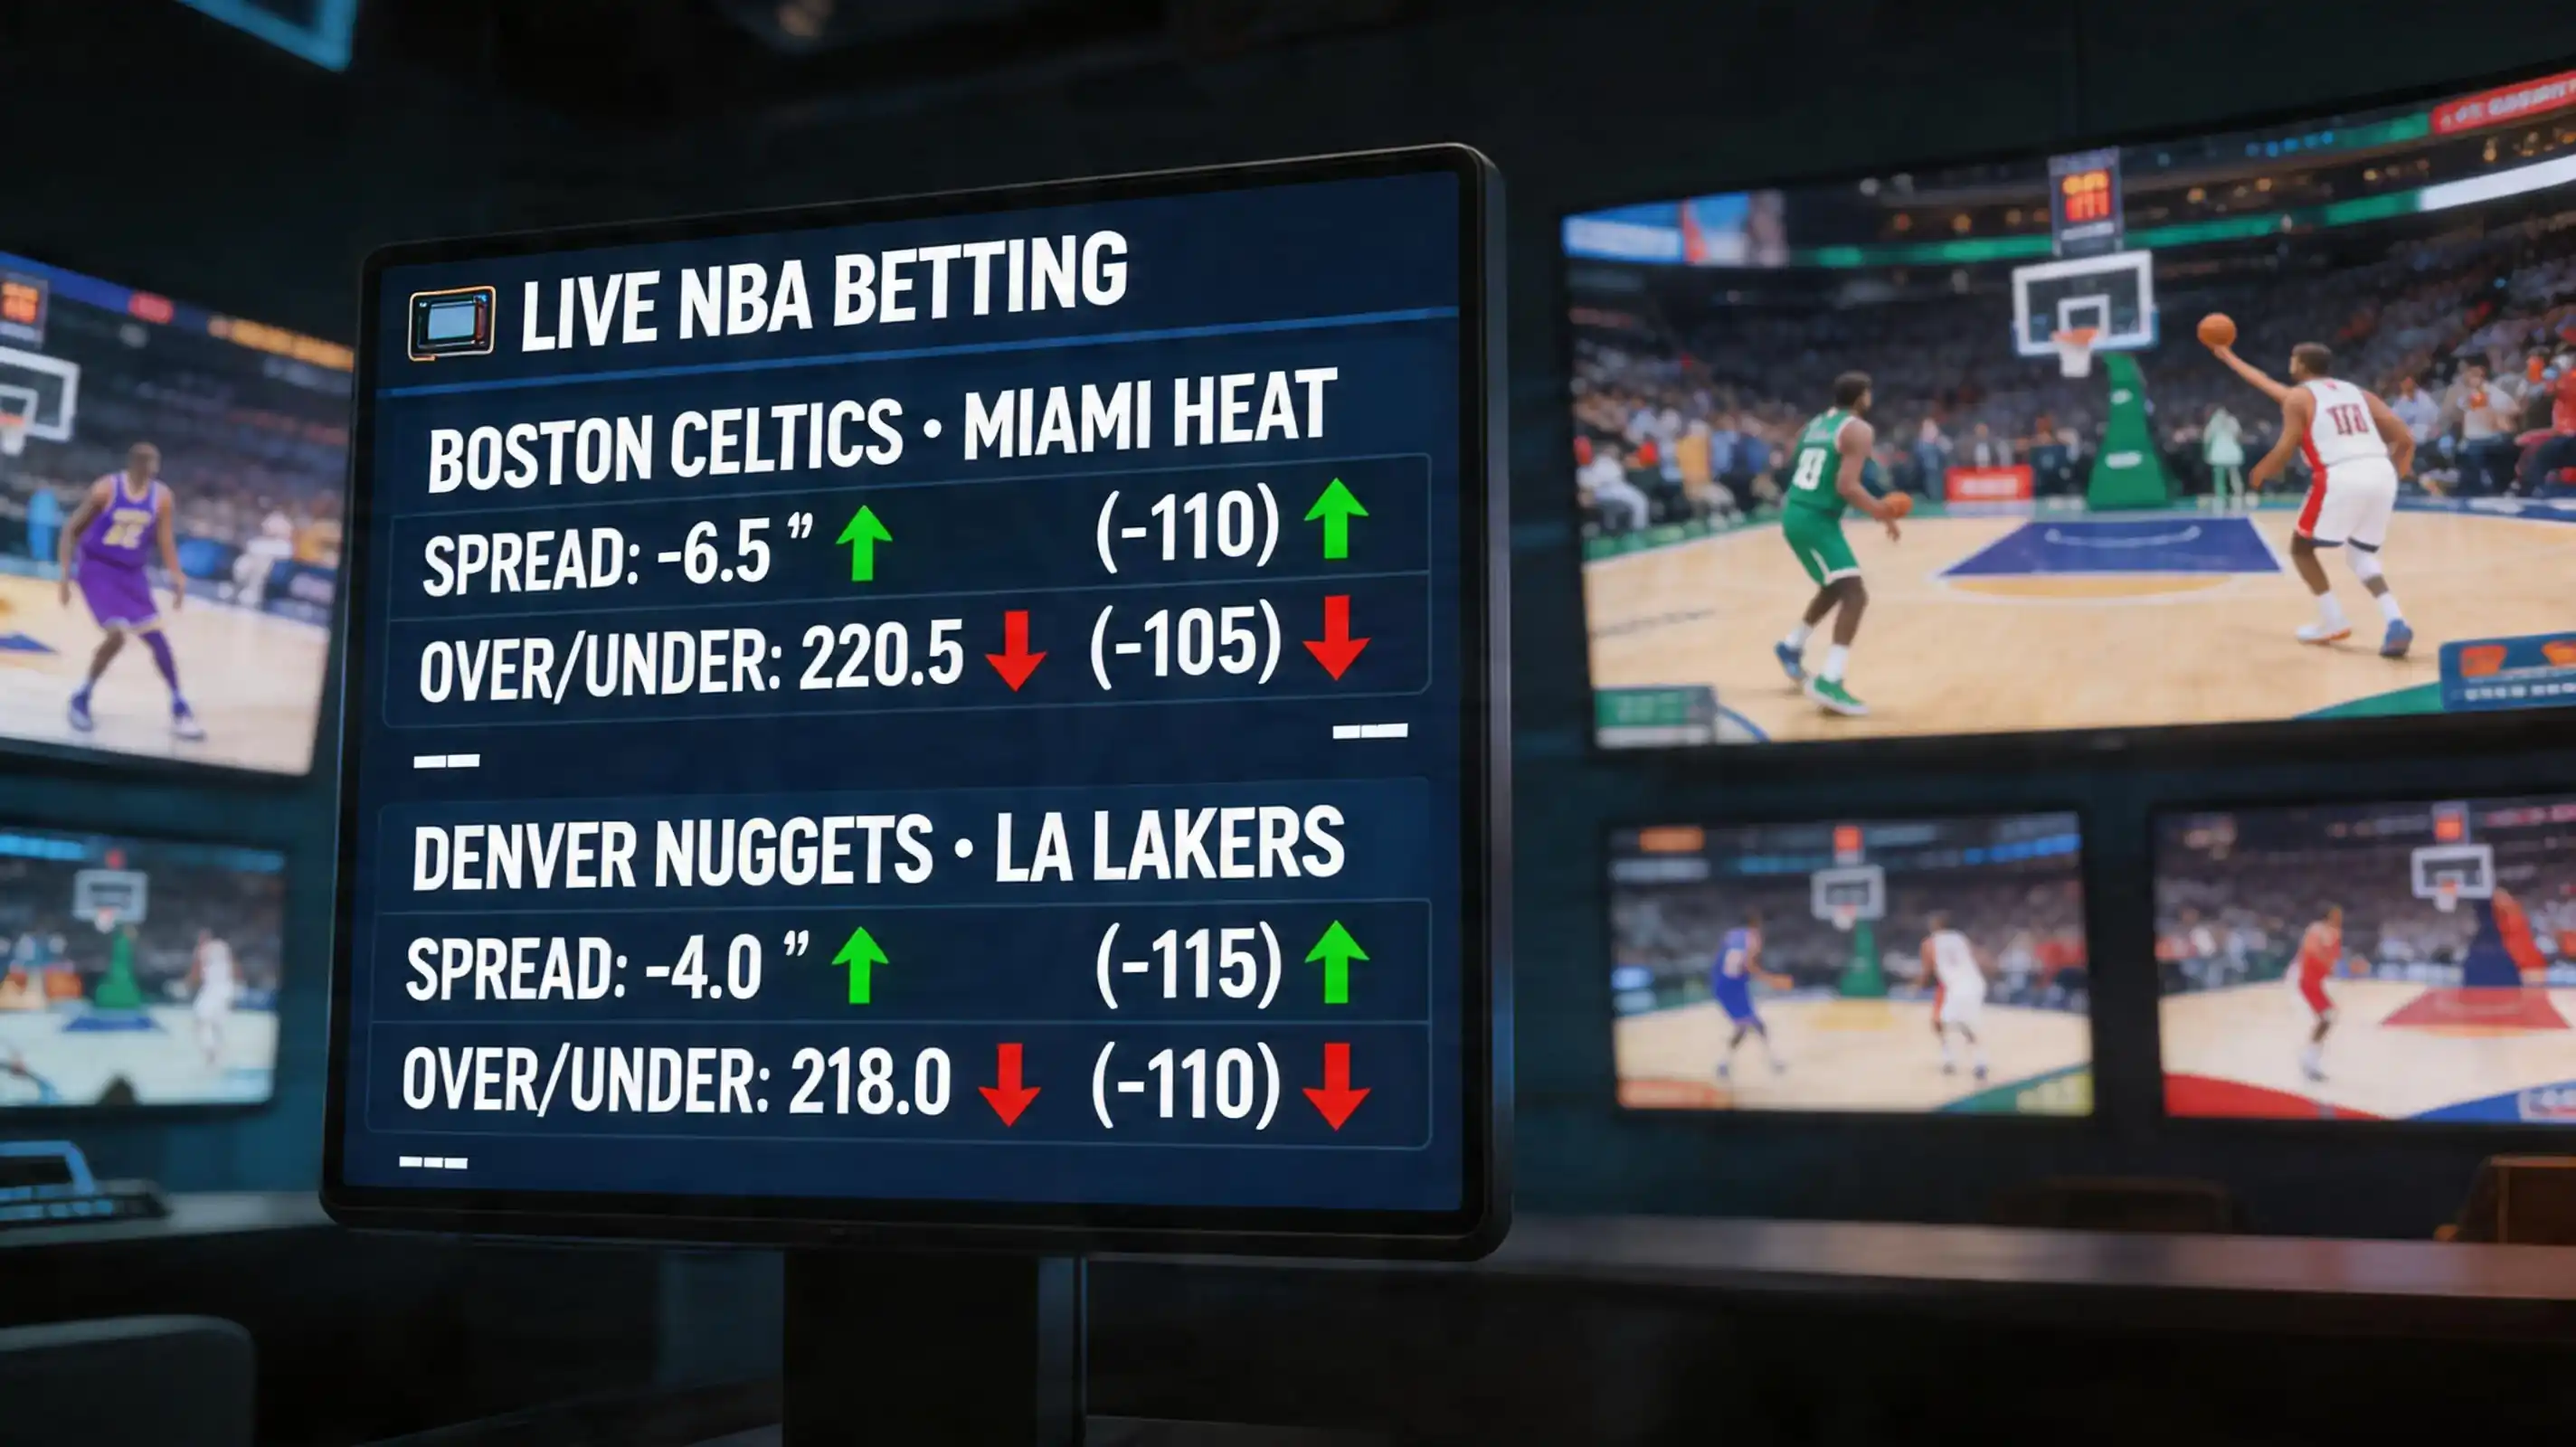
For strategic frameworks that incorporate schedule analysis into broader betting systems, NBA live betting strategy addresses how fatigue patterns manifest during games rather than just in opening spreads.
How much do back-to-back games affect NBA performance?
Teams on the second night of back-to-backs show measurable performance declines, particularly in fourth quarters where fatigue accumulates. Research indicates an effect size of -1.27 in physical decline between first and fourth quarters. The impact varies substantially based on travel distance, rest before the back-to-back, and whether key players are rested.
Do bookmakers fully price in back-to-back fatigue?
Markets adjust for obvious back-to-back situations but may underweight subtle scenarios. Lines typically move a full point for clear fatigue spots like road teams on second nights. Less obvious situations — home back-to-backs or rest advantage mismatches — see smaller adjustments that might not fully reflect the competitive impact.
Published by the Live Basketball Betting team.