Basketball Totals Betting: Over/Under Markets and Pace Analysis
 Available in US
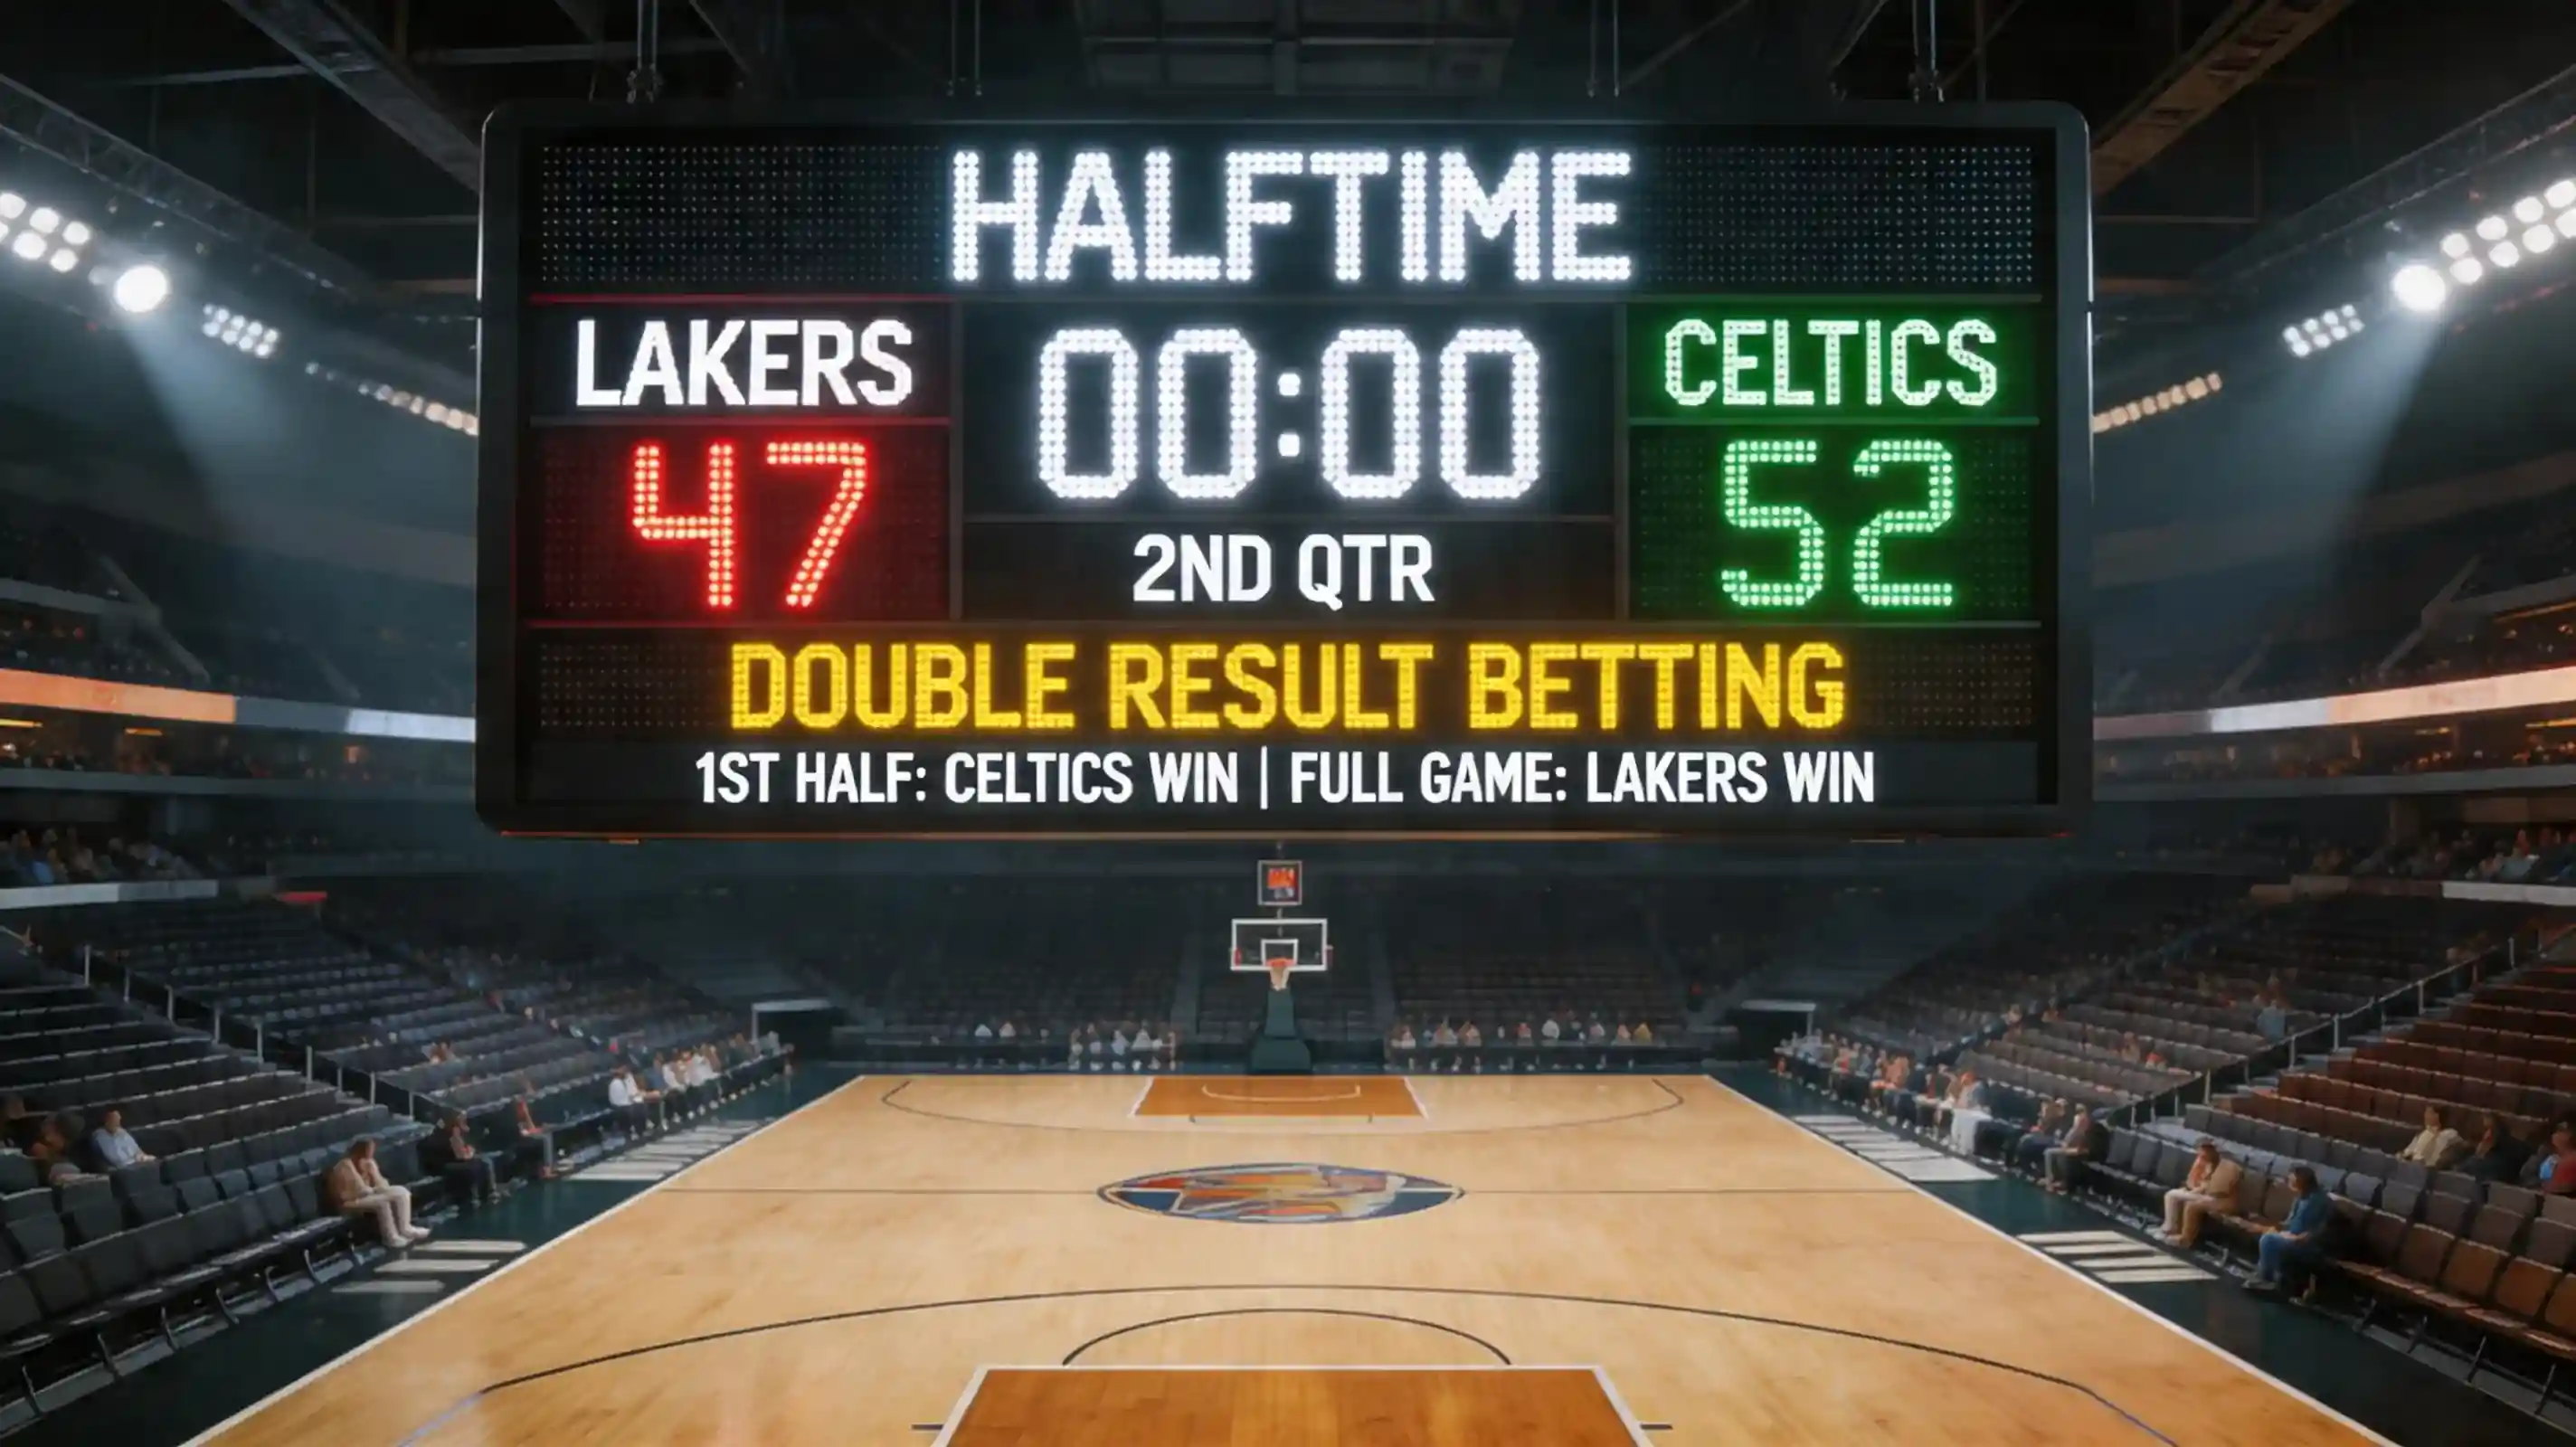
The night I truly understood totals betting, Golden State and Houston combined for 87 points in the first half of a game with a total of 228. Every casual bettor in my local had slammed the over — including me. We watched in disbelief as the second half produced just 96 combined points, the under cashing by two. That game taught me that totals aren’t about current pace. They’re about expected pace across forty-eight minutes of unpredictable basketball.
Over/under betting strips away the tribal element of picking winners. You’re not backing a team; you’re predicting a combined output. This detachment appeals to bettors who find spread betting too emotional, who want to watch a game without caring who wins as long as the baskets keep dropping — or don’t. It’s a purer form of basketball analysis, focused entirely on how the game will be played rather than who’ll emerge victorious.
Calculating Over/Under Value and Pace Statistics
The mechanics seem trivially simple: bookmakers post a number, you decide if the combined score will exceed or fall short. Take the over on 221.5 and you need 222 or more total points. Take the under and 221 or fewer gets it done. Half-points eliminate pushes, though some markets offer whole numbers with tie possibilities.
But beneath that simplicity lies genuine complexity. Totals synthesise dozens of variables — pace of play, offensive and defensive efficiency, rest factors, altitude, referee tendencies, even weather for outdoor arenas. The bookmaker’s number represents their best estimate of where balanced action will flow, not an objective prediction. Finding value means identifying when market consensus diverges from probable outcomes.
Historical context matters enormously. NBA totals have inflated dramatically over the past decade, tracking the league’s embrace of three-point shooting and faster pace. A 215 total that seemed high in 2015 looks low today. But recency bias cuts both ways — one high-scoring week doesn’t change underlying efficiency metrics. I track rolling averages over multiple time windows to distinguish real trends from noise.
The key numbers for totals differ from spread key numbers. Games don’t cluster around specific combined scores the way margins cluster around three or seven. Instead, totals key numbers emerge from common paths to certain scores — lots of made threes versus lots of made twos, or overtime pushing totals past thresholds. These patterns are subtler and require larger samples to identify reliably.
Pace Factors
Pace — possessions per game — is the single most important variable in totals analysis. A team that averages 105 possessions generates roughly 15% more scoring opportunities than one averaging 92. When fast teams meet, totals should inflate. When slow teams grind against each other, unders dominate. The interaction matters more than either team’s pace in isolation.
What complicates this seemingly straightforward analysis is that pace isn’t fixed. Teams adjust based on matchups. A team that runs against weak defences might slow down against elite rim protectors. Home teams tend to impose their pace preferences more successfully than road teams. Injuries to key ball handlers can crater possession counts overnight.
I’ve found that pace adjusts most dramatically in playoff basketball and late-season games with high stakes. Teams abandon their regular-season patterns when the pressure intensifies. That December game where both teams ran fast and loose looks nothing like their April rematch with seeding on the line. Totals set based on season-long pace metrics consistently miss these context-dependent adjustments.
Back-to-back games create predictable pace impacts. Teams playing their second game in two nights often slow down — fatigue affects the transition game first, leading to half-court possessions rather than fast breaks. Research shows NBA teams play an average of 14.9 back-to-back games per season, and the fatigue effect is measurable in pace statistics.
Referee assignments correlate with pace and scoring in ways the market frequently underweights. Certain crews call significantly more fouls, generating more free throw attempts. Others let physicality slide, favouring defensive teams. This data is publicly available, and I’ve built models that adjust totals expectations based on assigned crew. The edges are small but consistent.
Live Totals Strategy
Live totals move continuously throughout basketball games, and the algorithms driving those movements contain systematic biases that observant bettors can exploit. The core insight: live totals adjust to current pace but tend to overreact to recent scoring runs and underreact to predictable pace reversion.
First quarter scoring tells you less than you might think. Games that start hot often cool down as teams adjust defensively. Games that start cold frequently accelerate as offences find rhythm. Yet live totals adjust dramatically to early returns, creating windows where the market has overpriced recent events relative to expected normalisation.
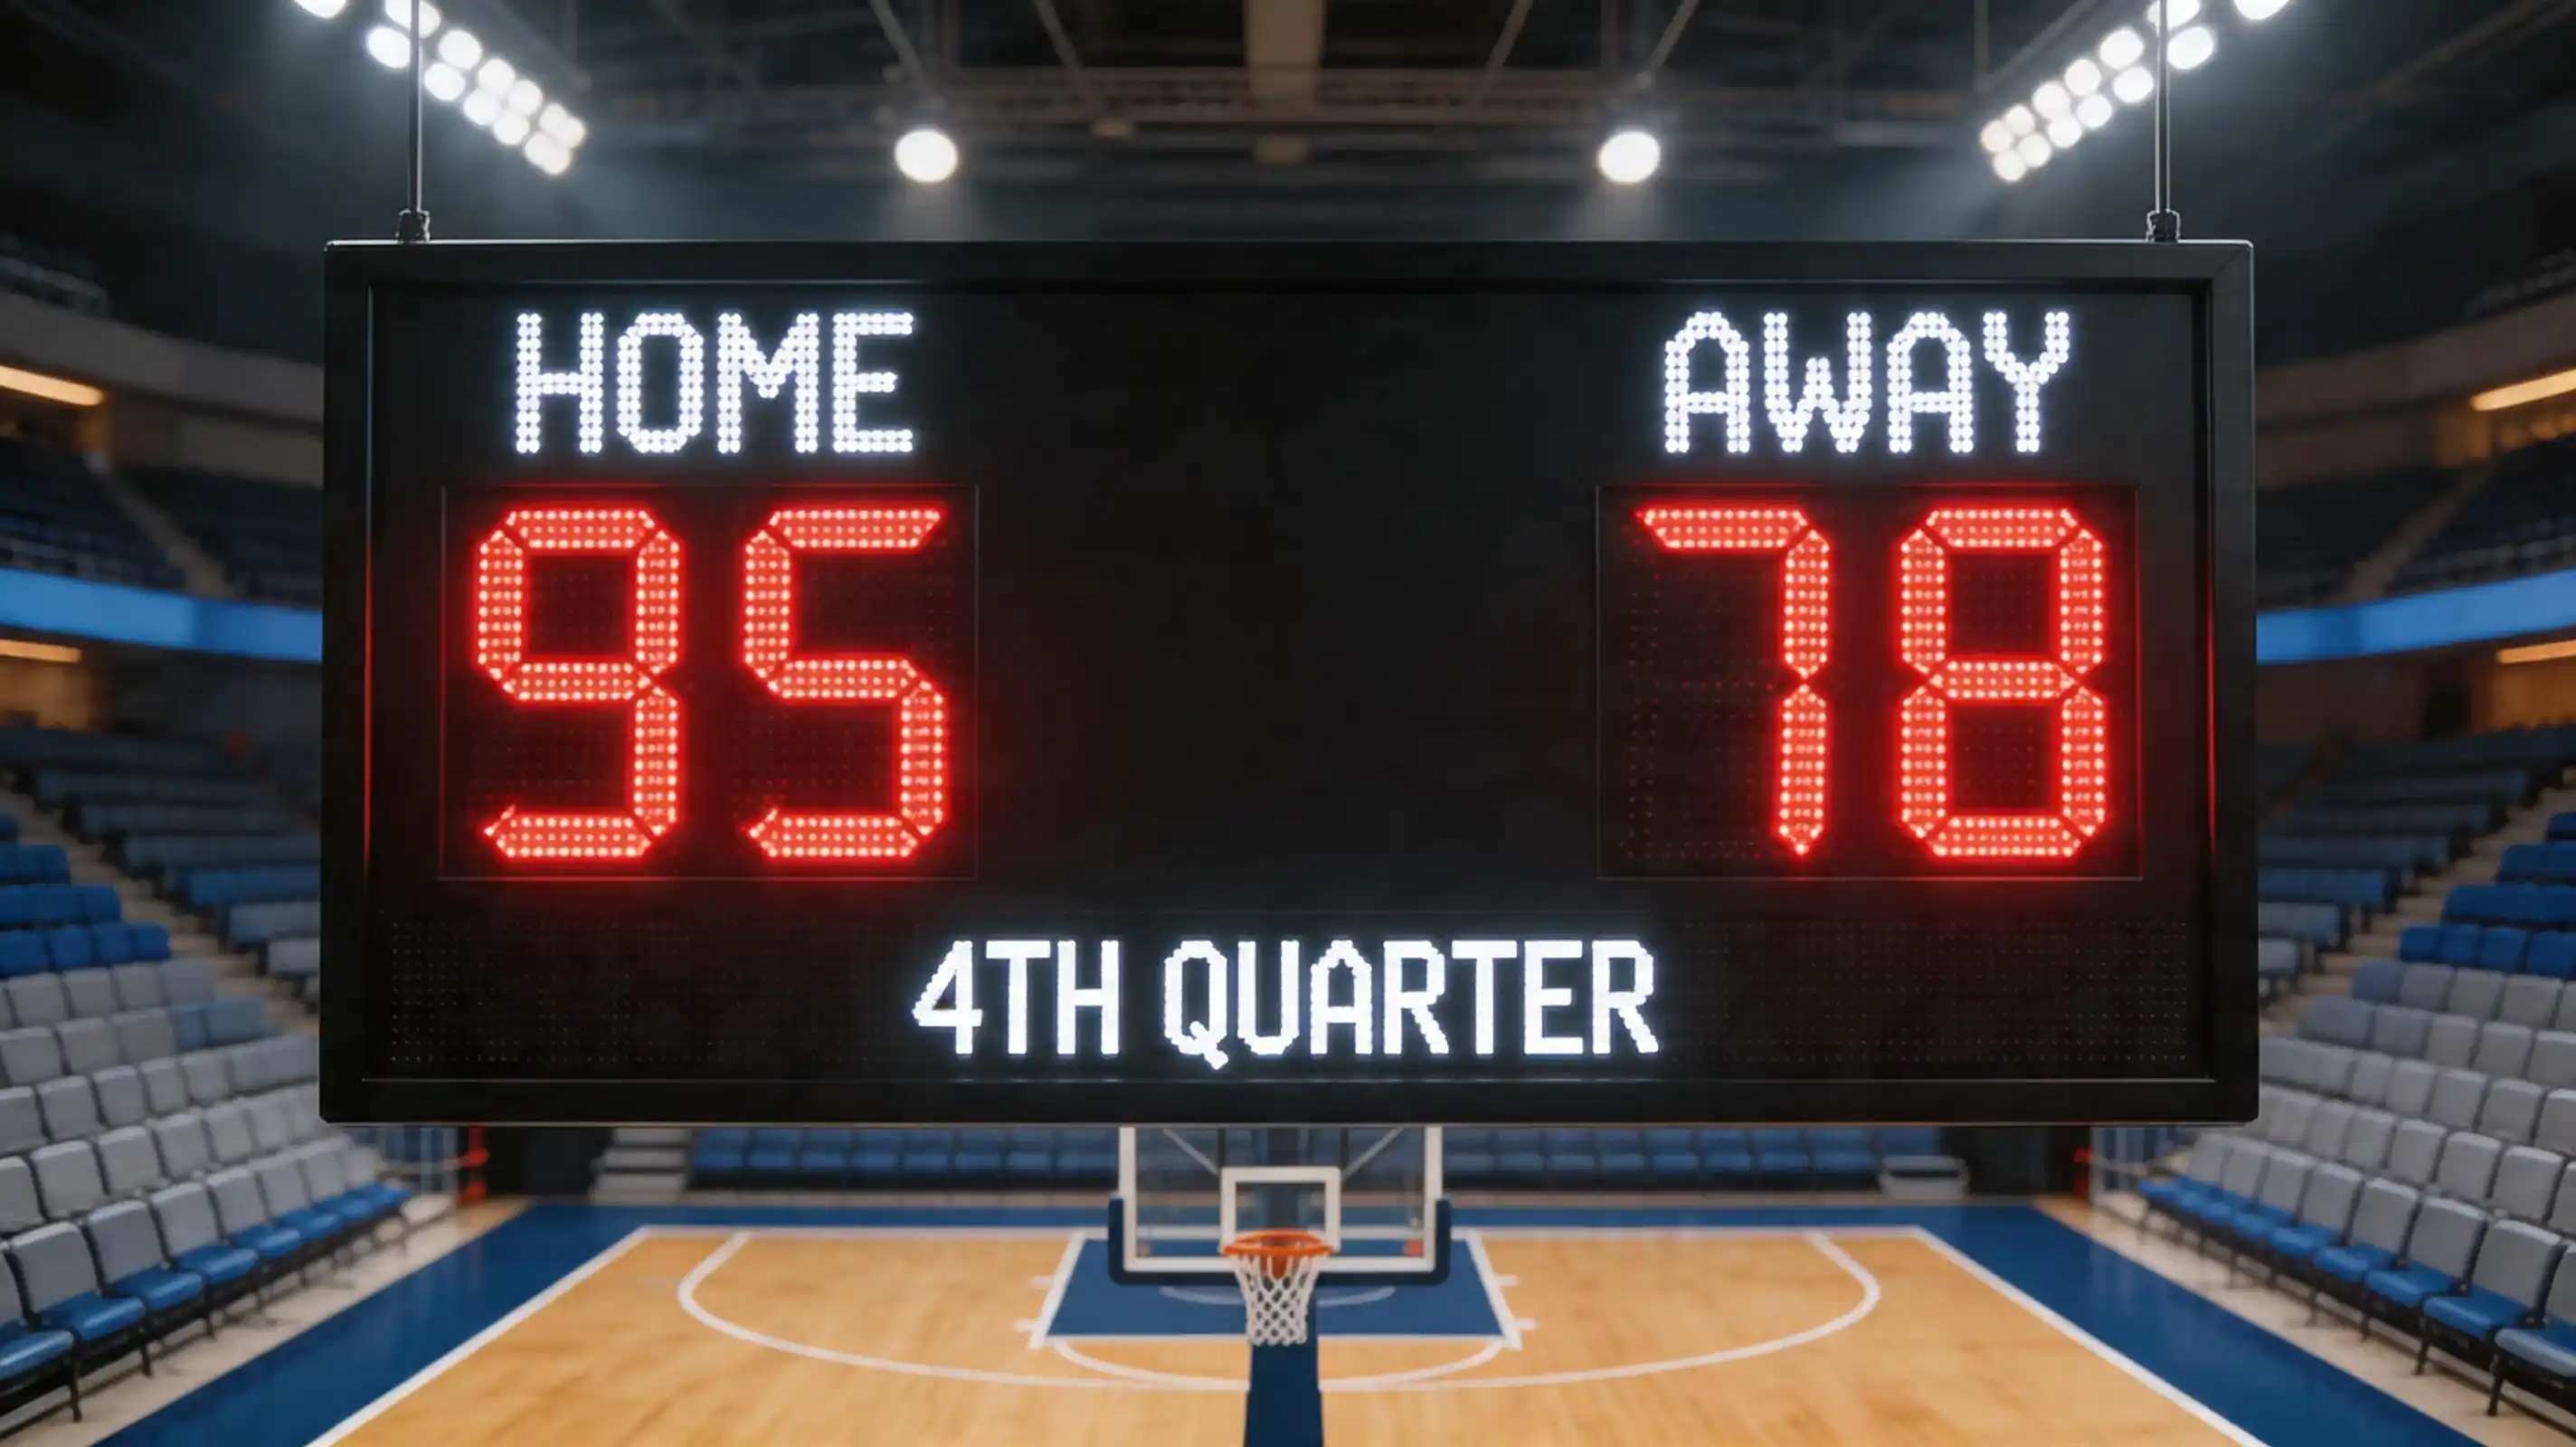
Fourth quarter dynamics present specific opportunities. As games enter the final period, 19% of NBA contests remain genuinely competitive — those are decided in clutch time. In the other 81%, garbage time sets in, second units play extended minutes, and scoring efficiency typically declines. Live totals set during the third quarter often don’t adequately price this fourth-quarter regression.
Timeout patterns create micro-opportunities in live totals markets. When a team calls timeout to stop a run, scoring pace temporarily inflates the live total. If you believe the timeout will actually work — halting the run and returning pace to normal — the immediate post-timeout window offers value on unders before the algorithms recalibrate.
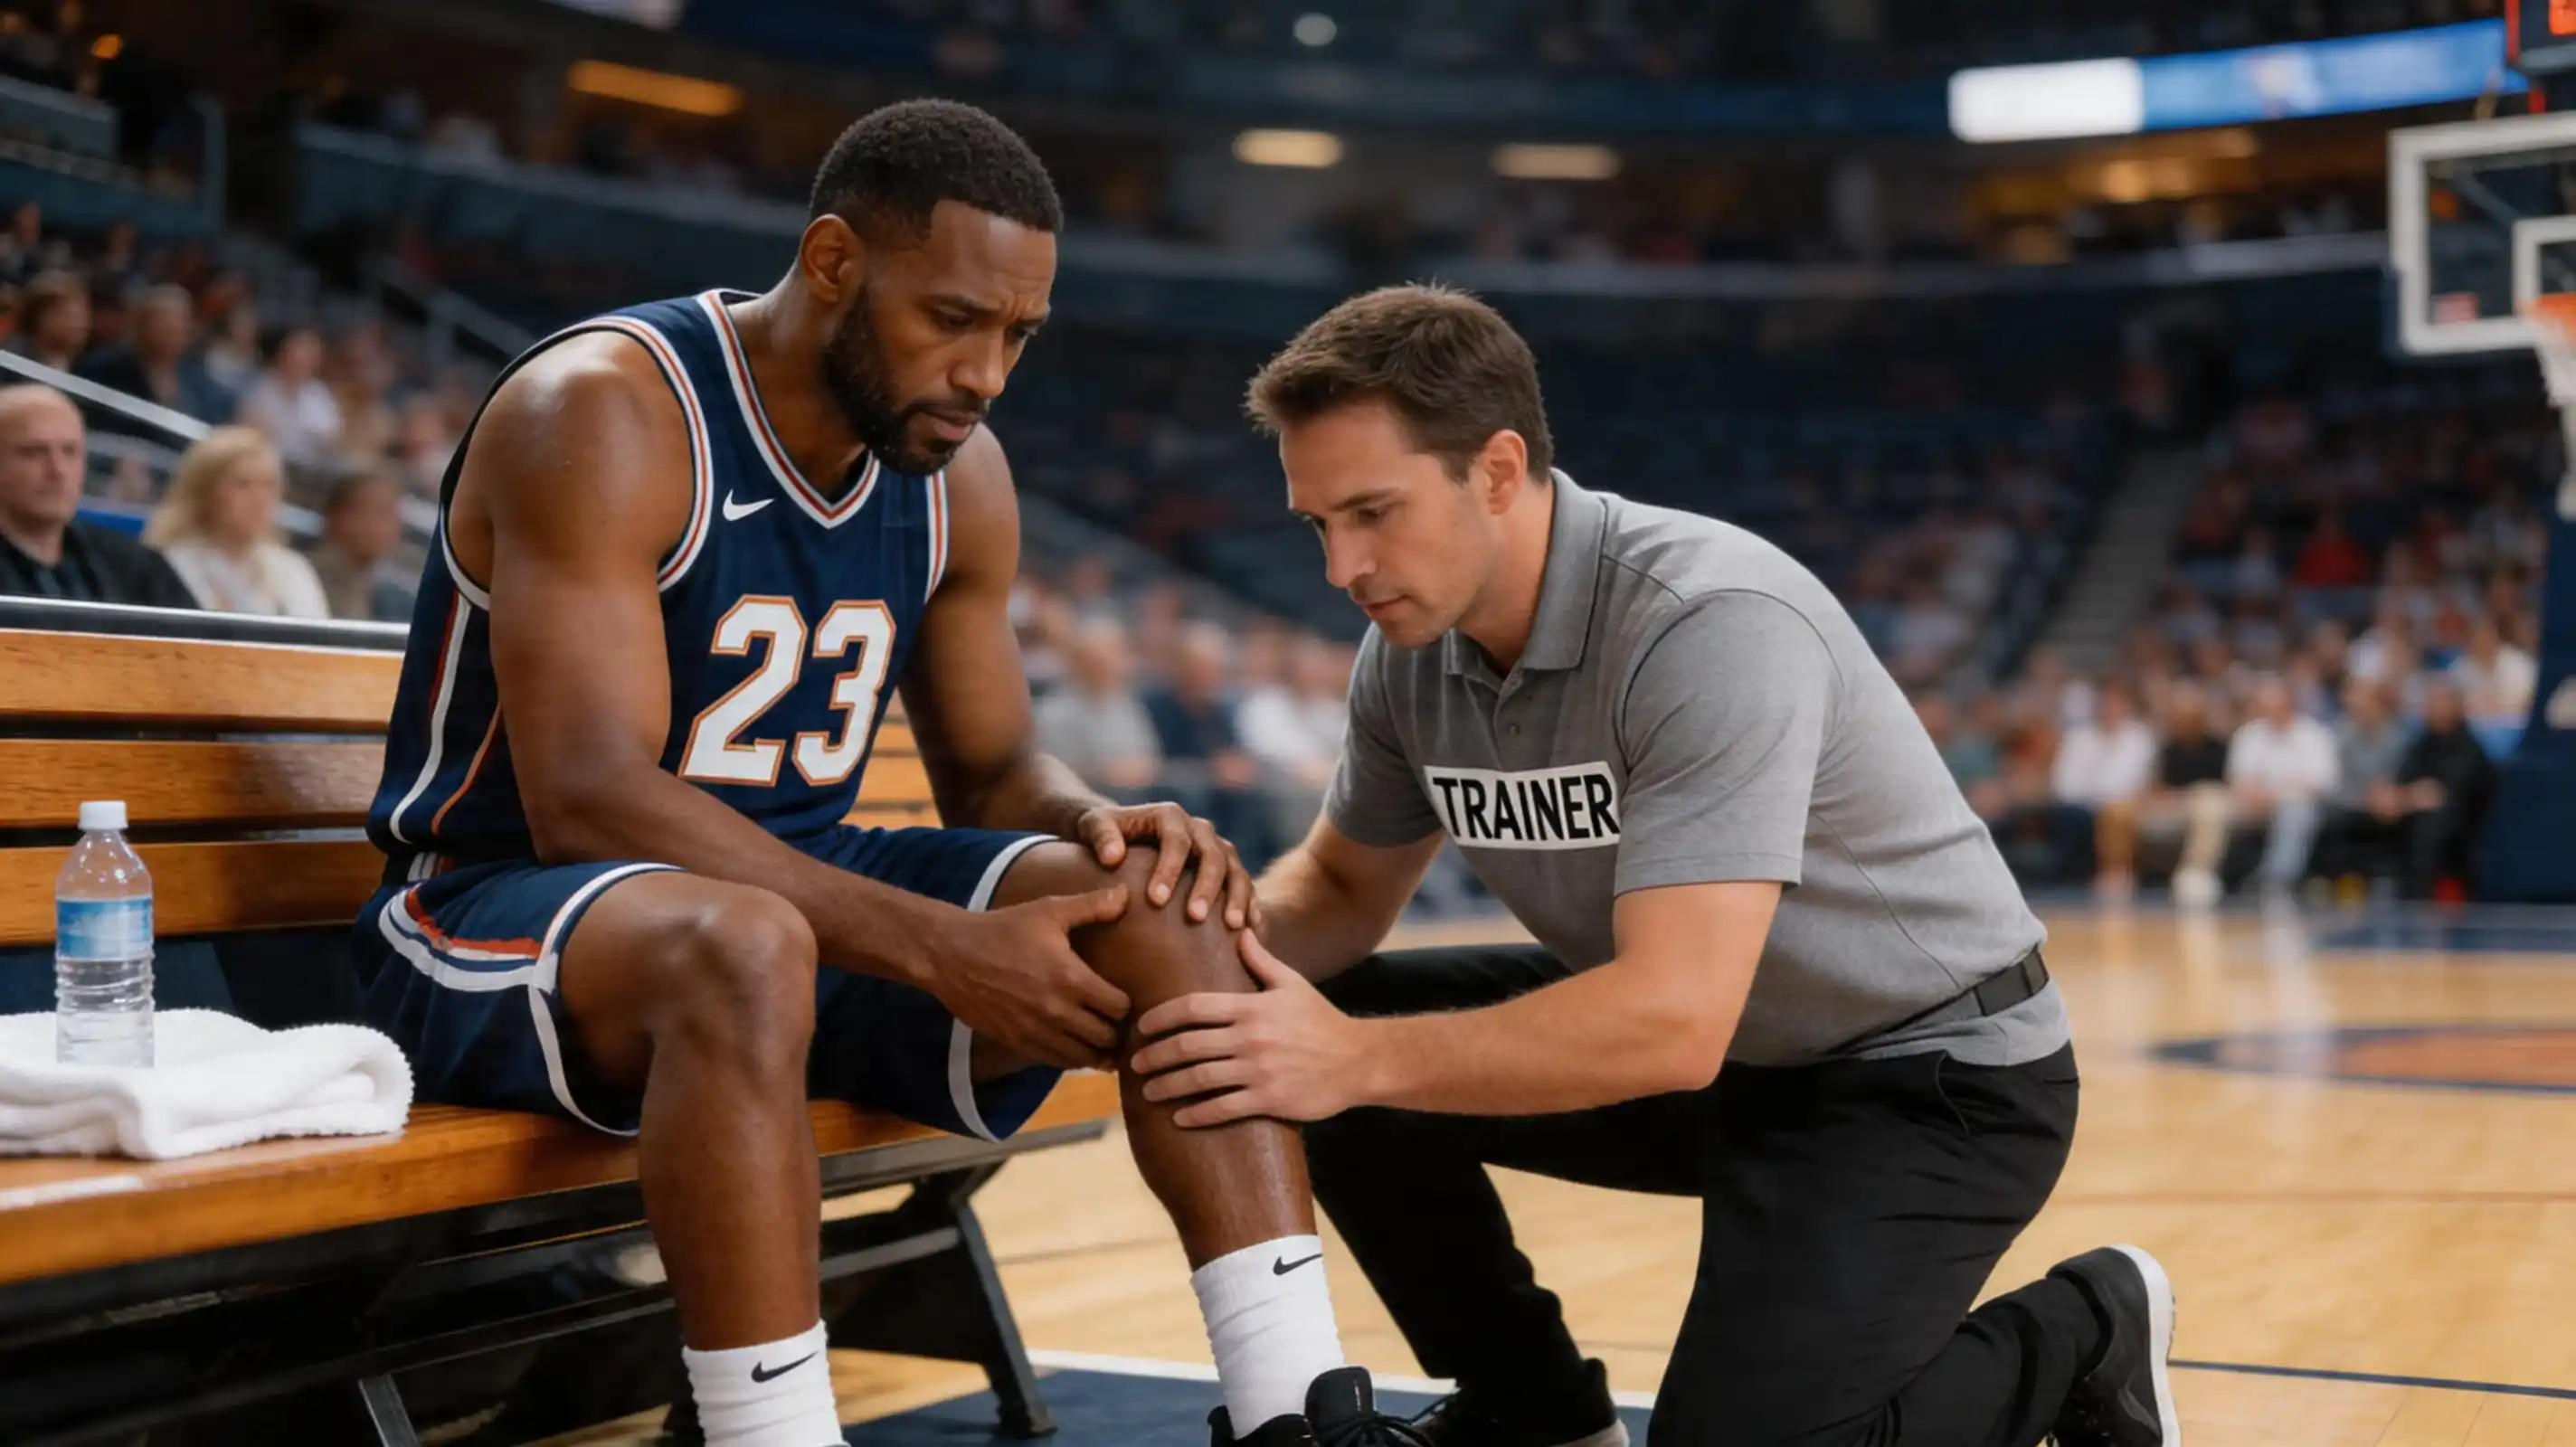
Foul trouble to key players affects totals more than most bettors realise. A star centre with four fouls in the third quarter means extended bench minutes, altered defensive schemes, and typically reduced offensive efficiency. Live totals adjust to the immediate absence but often miss the ripple effects that persist even after the player returns.
Team Totals
Team totals isolate one side’s scoring rather than combining both. This market offers precision that game totals can’t match — you can express a view on one team’s performance without taking an implicit position on their opponent’s output.
The value proposition differs from game totals. In game totals, both teams’ efficiency affects your bet. In team totals, only one team’s offence matters directly — though the opponent’s defence obviously constrains that output. This narrower focus suits matchup-specific analysis better than broad game-flow predictions.
I find team totals most useful when I have asymmetric views on the two sides. If I think Miami’s defence is elite but their offence is average, taking “opponent under” on their team total captures that view precisely. Game totals would force me to also take a position on Miami’s scoring, contaminating my analysis.
Live team totals behave slightly differently than game totals. Blowouts affect the losing team’s total disproportionately — they’re the ones pulling starters, playing prevent defence, and generally checking out. If the pre-game team total was 115.5 and they’re down 20 entering the fourth, their live total often drops to levels that assume capitulation. Sometimes that’s right. Sometimes the starters play longer than expected, creating over value.
Understanding totals deeply connects to broader live basketball betting strategy, since total movement patterns often signal momentum shifts before spread adjustments fully reflect them.
How does game pace affect basketball over/under betting?
Pace — possessions per game — directly determines scoring opportunities. Fast-paced teams averaging 105 possessions generate significantly more chances than slow teams at 92. When two fast teams meet, totals inflate accordingly. The interaction between both teams’ pace preferences, adjusted for matchup context and fatigue factors, drives expected combined scoring.
What factors cause live totals to move during a game?
Live totals adjust to current pace, recent scoring runs, and game flow every few hundred milliseconds. First quarter scoring, timeout patterns, foul trouble, and garbage time in blowouts all trigger recalculations. The algorithms tend to overreact to recent events whilst underweighting predictable reversion to typical pace patterns.
Published by the Live Basketball Betting team.